Delhi Needs to Cut Pollution by 65% to Meet Air Quality Standards
 The Winters are coming
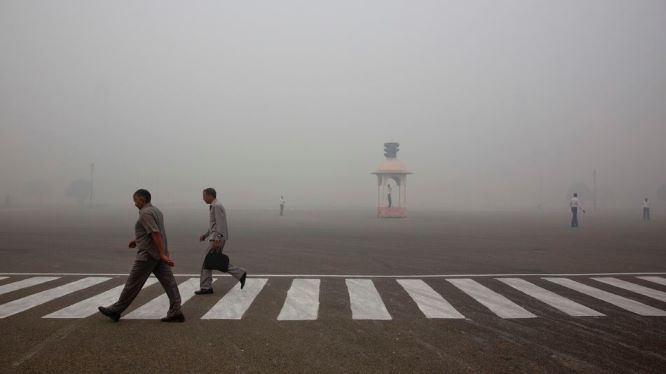
National capital Delhi, which has been battling air pollution for years, needs to cut at least 65% of its air pollution to meet the air quality standards. This was revealed in the latest analysis by the Centre for Science and Environment (CSE) at a round table on the next steps for National Clean Air Programme (NCAP) – what other cities in India should do.
The Nonprofit did the analysis of annual air quality data submitted by the Central Pollution Control Board (CPCB) to the parliament. The data shows that the three-year average of PM2.5 levels during 2016-2018 is 25 percent lower than the 2011-2014 baseline (three-year average). However, CSE cautions that even after this reduction and stabilisation, Delhi faces the daunting challenge of 65 percent reduction from the current baseline to meet the clean air standards for PM2.5.
We had earlier reported that NCAP hasn’t had much success in impressing environmentalist and UN has also shown reluctance about the success of environment rules making any difference on ground. The results of this ongoing study highlight Delhi’s struggle with air pollution.

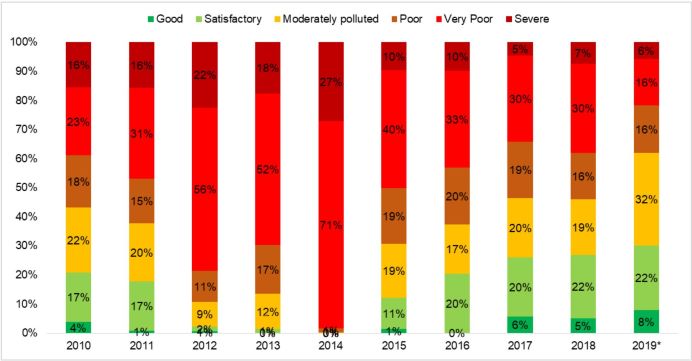
*Data available till August 25 for the year 2019
CSE says that the stabilisation has been the result of multi-sector intervention to clean up the vehicle fleet and fuels, tightening of industrial pollution control and phase-out of dirty industrial fuels of pet coke, furnace oil and coal, shutting down of all coal power plants in the city, action on brick kilns and hotspot areas, and dust control in construction sites with some efforts to control pollution from waste.
Anumita Roy Chowdhury, executive director-research and advocacy, CSE said: “While this level of action has helped in stabilising the problem, much harder decisions and aggressive action at a scale is needed to achieve 65 percent cut in PM2.5 to meet the clean air targets.”
Highlights of the report:
- 75 percent of monitored cities ‘critically’ polluted
- CPCB air quality data submitted to parliament show that three-year average annual PM2.5 level in 2016-2018 is 25 percent lower than the three-year average level in 2012-2014.
- Between 2011 and 2018-19, days with severe-plus PM2.5 levels have lessened after 2015; pattern, duration and frequency of smog episodes are changing, and more days with lower air pollution levels are recorded during 2016 to 2018-19.
- Overall peak levels reducing overtime, while the number of days meeting the standard is increasing during summer and monsoon months.
- Winter smog episodes getting fewer but longer – a change from the earlier trend in which the episodes were frequent and random. The onset of winter pollution is also getting delayed.
- Only 3 percent of cities have pollution levels below the standards — NCAP aims to reduce particulate pollution by 20-30 percent, but for most cities, the challenge of target reduction is as high as 40-76 percent.
- With clean air action plans taking shape in 122 noncompliant cities and Delhi entering its next phase of action, CSE calls for third-generation solution-oriented multi-sector action at a scale that ensures enforcement and compliance.
“Nature of this action is not small. But this has helped to only stabilise the problem and bend the curve slightly. This only indicates how much more will have to be done at a scale and with effectiveness across the region to make a difference,” Roy Chowdhury said.
Delhi is the microcosm of change that has thrown up important evidence and lessons for other cities. This city and the rest of the country requires massive mobility transition, clean energy and technology transition, and waste reduction transition at a regional level to help meet clean air targets.
To see the official presentation, click here.


